Beautiful Sales Reporting With Push-Button Export
Export your data with a simple push-button copy/paste to a spreadsheet. Use sales insight to support better decisions for your online business.
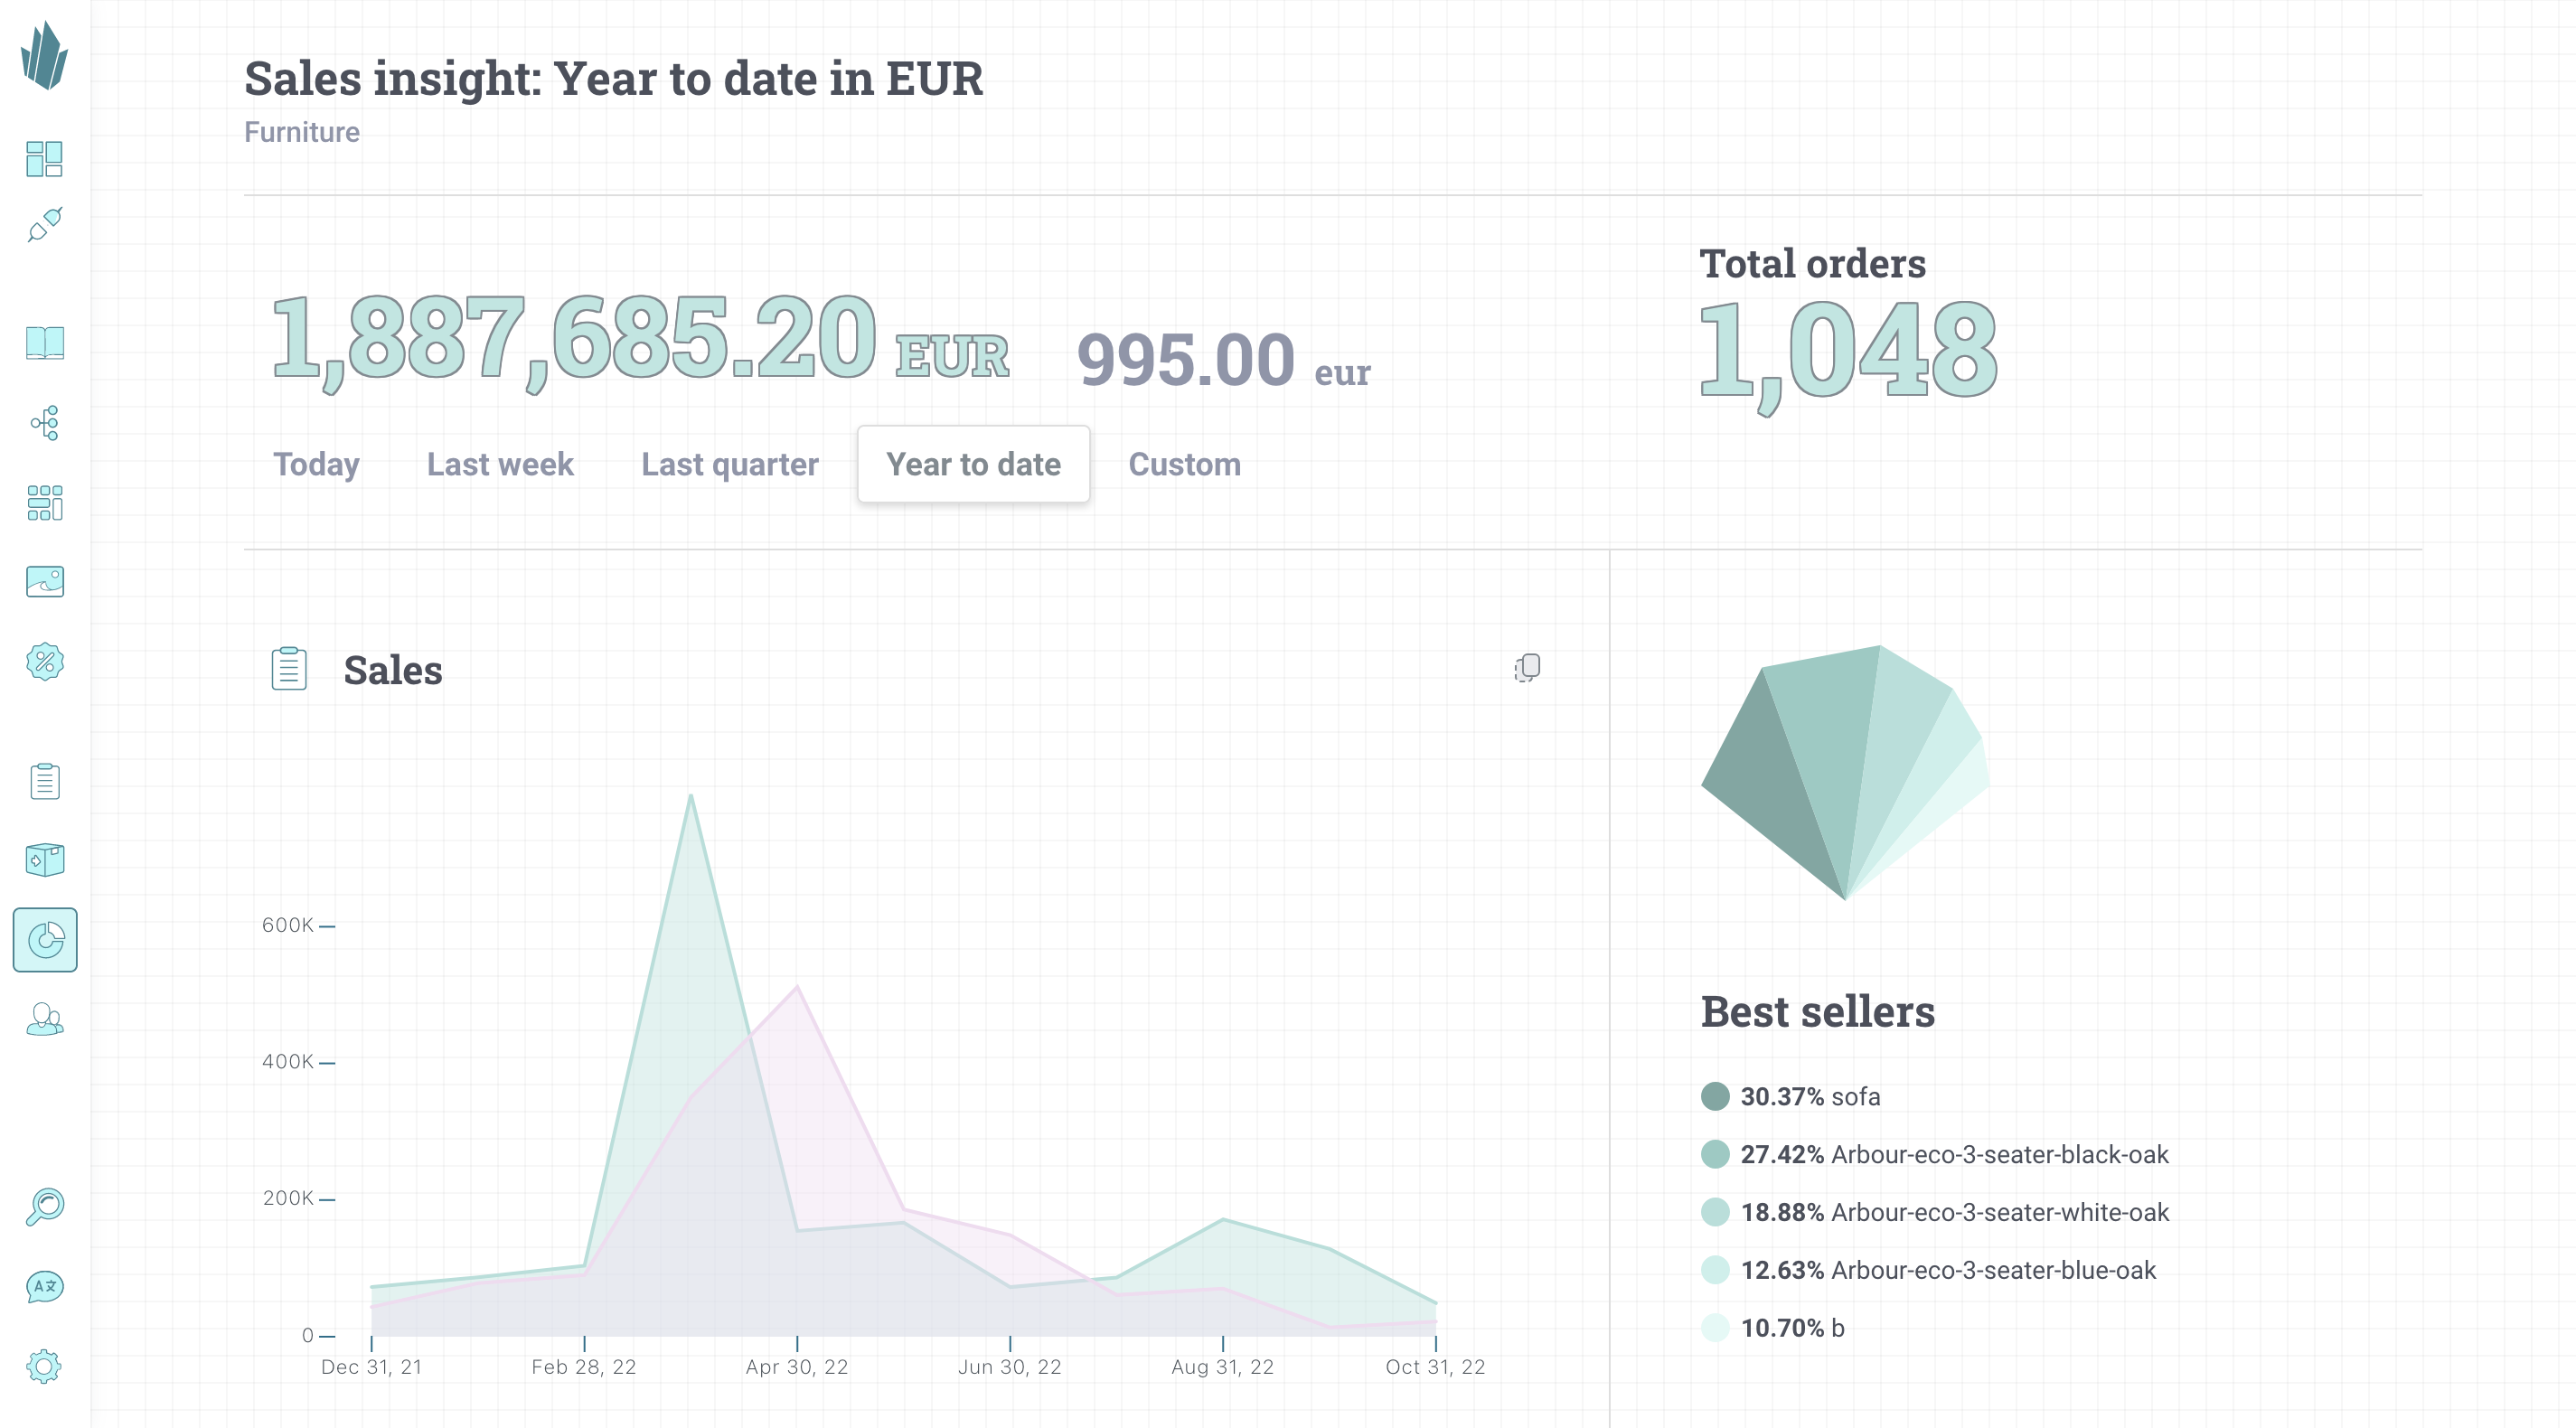
The new sales insight and sales reporting API is now available for all Crystallize tenants. Multi-currency sales reporting with fast and beautiful graphs, in any currency.
Beautiful Sales Insight Reports
Sales insight is now available for all orders in your Crystallize tenant. Analyze multiple currencies and get an immediate overview of how your sales are doing. Real-time data.

Copy / Paste to Spreadsheet
Exporting your sales data is as simple as pushing a button. All graphs are exported to the clipboard and can be pasted into your favorite spreadsheet for further analysis.
Copy / Paste to Spreadsheet
Exporting your sales data is as simple as pushing a button. All graphs are exported to the clipboard and can be pasted into your favorite spreadsheet for further analysis.
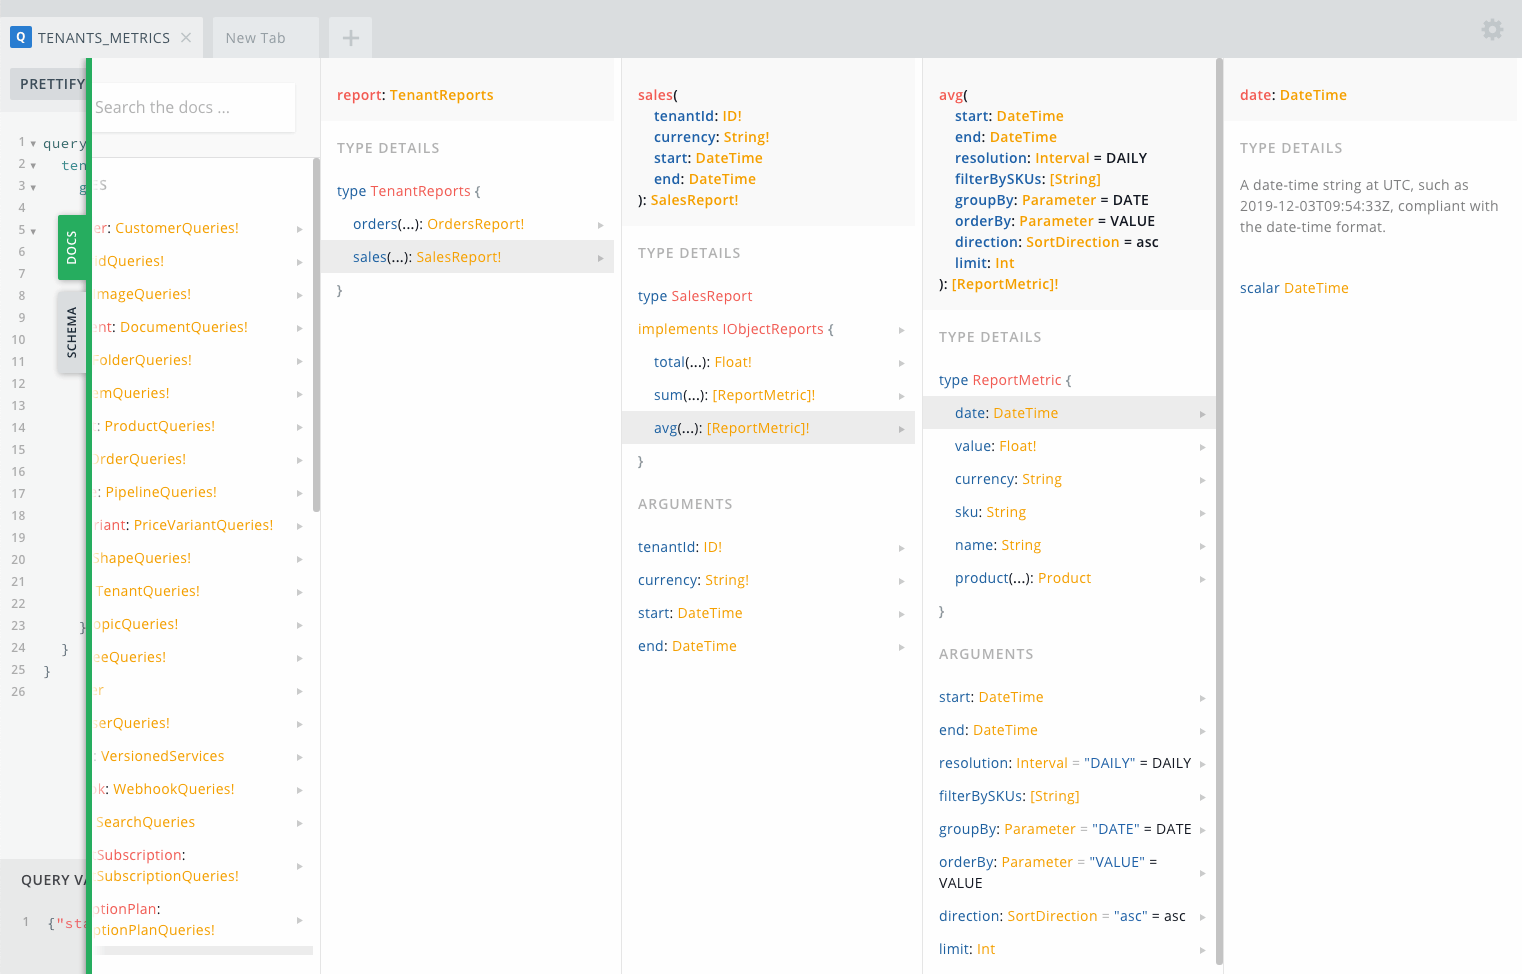
Build Your Own Reports with the Fast API
To dive even further into the data, you can use the GraphQL sales reporting API. The sales reporting API gives you full access to all sales data. Use it to build custom reports or dashboards.

Give it a try. START building for FREE with Crystallize.
