Sales insight
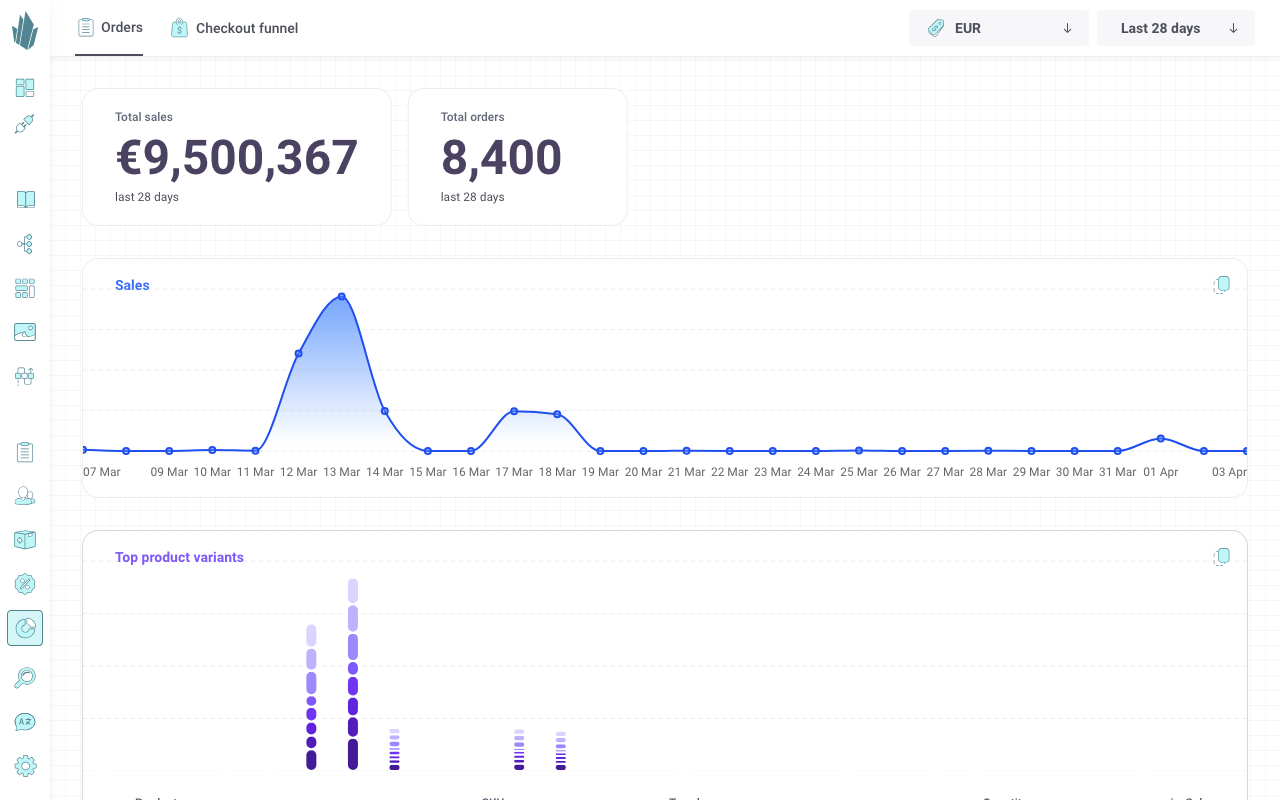
The Sales Insights dashboard gives you detailed metrics on product performance over any chosen date range. This allows you to track revenue, compare products, and analyze trends in your sales data.
You can easily export sales data using the Copy data to clipboard button. This lets you paste the data into spreadsheets, BI tools, or reports for further analysis.
Products by Sales
The Products by Sales section visualizes the development of sales per SKU (product variant).
Key features:
- Top performers by default
The chart initially displays the top 3 products by sales volume. - Search and add products
Use the global search bar to find any product.
Drag and drop items from the search results directly into the chart for analysis. - Dynamic chart updates
Once added, sales data for the selected product variants loads automatically. Each variant appears on the chart with a color-coded line and a corresponding entry in the legend. - Toggle visibility
Click the colored circles in the legend to show or hide specific product variants. This makes it easier to focus on a single product or compare a smaller group. - Grouped variants
Product variants without sales data are grouped together. Expand the collapsible section to view them.

Typical Use Cases
- Track product launches – See how new SKUs perform over time.
- Compare regions or catalogs – Add variants from different price lists to see market-specific trends.
- Identify growth drivers – Quickly spot which products are contributing most to revenue.
- Spot declining products – Monitor sales drops early and adjust campaigns or pricing.
Key Gains
- Sales Insights give you a clear view of product performance across any time range.
- Charts are interactive, searchable, and customizable to your needs.
- Export functionality makes it easy to integrate sales data into external tools.